Elearn Infotech
Madhapur, Hyderabad · Classroom & Online

Data Analytics Course in Hyderabad

Learn how businesses turn raw data into useful insights with the premier Data Analytics Course in Hyderabad at Elearn Infotech. Conveniently located in Madhapur (easily accessible from Gachibowli, Kondapur, KPHB and Ameerpet), this practical program is designed for freshers, graduates, working professionals, and career switchers who want to build skills for modern analytics roles.

You will work with industry-relevant tools including Excel, SQL, Python, Power BI, and Tableau, while learning statistics, data cleaning, visualization, reporting, and business-focused analysis.

The Data Analytics training in Hyderabad combines structured learning with assignments, case studies, real-time projects, mentorship, and 100% placement assistance to help you build practical confidence—not just theoretical knowledge. Join Elearn Infotech and start building your Data Analytics career in Hyderabad.

Register for a Free Demo
Get a callback within 24 hours — no cost, no obligation.
Thanks! Our team will call you shortly to schedule your demo.
ISO 9001:2015
Certified
Startup India
Recognized
12+ Years
Experience
45,000+
Students Trained
3 MonthsStructured training
4+1Real-time projects
ExcelReporting & dashboards
SQLQuerying & analysis
PythonData analysis
Power BIDashboards
TableauVisualization
Our Students Have Been Placed At

Data Analytics Course Highlights

Everything you need in one program — grouped into what you'll learn, how you'll practice, and how you'll get placement-ready.

Core Training & Tools

  • 3 Months of structured training
  • Advanced Excel & SQL
  • Python for Data Analysis
  • Statistics for analytics
  • Data cleaning & transformation

Hands-on Practice

  • Real-time projects
  • Power BI & Tableau dashboards
  • Exploratory Data Analysis
  • Business analytics & reporting
  • Assignments & case studies

Career Readiness

  • Portfolio & capstone project
  • Expert mentorship
  • Resume preparation
  • Mock interviews
  • Placement assistance

Available in both classroom (Madhapur) and online learning formats.

WHY DATA ANALYTICS

Why Learn Data Analytics?

Companies collect large amounts of information from customers, sales, marketing campaigns, finance, operations, and other business activities. The real value comes from understanding that information and using it to make better decisions.

From records to patterns

Data Analytics helps you develop the ability to collect, clean, explore, visualize, and interpret data. Instead of looking at numbers as isolated records, you learn how to identify patterns, understand performance, and communicate meaningful insights.

Open to any background

A career in analytics can also be suitable for people from different educational backgrounds. At Elearn Infotech, the program is designed for graduates, freshers, IT and non-IT professionals, and people planning a career transition.

Fundamentals first

The course starts with fundamentals and gradually introduces tools and techniques used in practical data analyst analytics projects.

Not sure if analytics is right for you?

Talk to a career advisor about your background, goals and the best learning path.

Talk to an advisor
CURRICULUM AT A GLANCE

What You'll Learn

Build a strong foundation in spreadsheet-based analysis.

Excel fundamentalsData organization and formatting Formulas and functionsLookup functions Conditional calculationsSorting and filtering Data validationPivot Tables Pivot ChartsData cleaning in Excel Charts and reportingInteractive dashboards Advanced Excel techniques

Learn how to work with structured business data stored in databases.

SQL fundamentalsDatabase concepts Creating and managing tablesSELECT statements Filtering and sorting dataAggregate functions GROUP BY and HAVINGJoins SubqueriesConditional expressions Date and string functionsData modification ViewsPractical business queries Query-based data analysis

Learn Python from an analytics perspective and use it to work with datasets.

Python fundamentalsVariables and data types OperatorsConditional statements LoopsFunctions Lists, tuples, sets, and dictionariesFile handling Exception handlingNumPy basics PandasDataFrames and Series Data cleaningData transformation Exploratory Data AnalysisData visualization Working with real-world datasets

Understand the statistical concepts required to interpret data correctly.

Descriptive statisticsMean, median, and mode Range and varianceStandard deviation PercentilesProbability fundamentals DistributionsCorrelation Regression basicsSampling Hypothesis testing fundamentalsInterpreting statistical results

Turn business data into interactive dashboards and reports.

Power BI introductionConnecting data sources Importing datasetsData cleaning Power QueryData transformation Data modellingRelationships DAX fundamentalsMeasures and calculated columns Charts and visualizationsFilters and slicers Interactive dashboardsReport design Dashboard publishingBusiness reporting

Learn how to visually explore and communicate data.

Tableau fundamentalsConnecting datasets Dimensions and measuresData preparation ChartsFilters CalculationsDashboards Interactive visualizationsKPI reporting Dashboard designBusiness insights and storytelling
MODULE BY MODULE

Detailed Data Analytics Course Curriculum

  • What is Data Analytics?
  • Data Analytics vs Data Science
  • Types of Data Analytics
  • Descriptive Analytics
  • Diagnostic Analytics
  • Predictive Analytics
  • Prescriptive Analytics
  • Business understanding
  • Analytics workflow
  • Understanding real-world datasets
  • Data-driven decision making

  • Excel interface and fundamentals
  • Data formatting
  • Formulas and functions
  • Logical functions
  • Text functions
  • Date and time functions
  • Lookup functions
  • Data validation
  • Sorting and filtering
  • Conditional formatting
  • Removing duplicates
  • Data cleaning
  • Pivot Tables
  • Pivot Charts
  • Advanced charts
  • Dashboard creation
  • Business reporting

  • Database fundamentals
  • Relational databases
  • Tables and relationships
  • SELECT queries
  • WHERE conditions
  • ORDER BY
  • DISTINCT
  • Aggregate functions
  • GROUP BY
  • HAVING
  • Joins
  • Subqueries
  • CASE statements
  • String functions
  • Date functions
  • Data analysis queries
  • Business scenarios using SQL

  • Python introduction
  • Variables and data types
  • Operators
  • Conditional statements
  • Loops
  • Functions
  • Collections
  • File handling
  • Exception handling
  • NumPy introduction
  • Pandas introduction
  • Series and DataFrames
  • Importing datasets
  • Handling missing values
  • Removing duplicates
  • Data transformation
  • Data aggregation
  • Exploratory Data Analysis
  • Visualization with Python

  • Fundamentals of statistics
  • Population and sample
  • Measures of central tendency
  • Measures of dispersion
  • Probability basics
  • Data distributions
  • Correlation
  • Regression fundamentals
  • Sampling concepts
  • Hypothesis testing
  • Statistical interpretation
  • Applying statistics to business data

  • Understanding raw datasets
  • Identifying missing data
  • Handling duplicate records
  • Correcting inconsistent values
  • Data type conversion
  • Outlier identification
  • Data transformation
  • Combining datasets
  • Preparing analysis-ready data
  • Data quality checks

  • Understanding EDA
  • Asking analytical questions
  • Exploring distributions
  • Identifying trends
  • Finding relationships
  • Detecting anomalies
  • Segmenting data
  • Correlation analysis
  • Visual exploration
  • Extracting actionable insights

  • Power BI ecosystem
  • Data sources
  • Importing data
  • Power Query
  • Data cleaning
  • Data transformation
  • Data modelling
  • Relationships
  • DAX fundamentals
  • Calculated columns
  • Measures
  • KPIs
  • Interactive visuals
  • Filters and slicers
  • Dashboard creation
  • Report publishing
  • Business intelligence reporting

  • Tableau fundamentals
  • Connecting to data
  • Data preparation
  • Dimensions and measures
  • Basic visualizations
  • Advanced charts
  • Filters
  • Calculated fields
  • Interactive dashboards
  • KPI dashboards
  • Business reporting
  • Data storytelling

  • Understanding business requirements
  • Defining KPIs
  • Identifying business questions
  • Selecting appropriate metrics
  • Creating management reports
  • Finding trends and patterns
  • Converting analysis into insights
  • Presenting findings
  • Data storytelling
  • Communicating recommendations

  • Introduction to AI-assisted analytics
  • Using AI for data exploration
  • Generating analytical ideas
  • Query assistance
  • Report and insight assistance
  • Productivity workflows
  • Responsible use of AI in analytics

  • Dataset selection
  • Business problem definition
  • Data preparation
  • Analysis
  • Visualization
  • Dashboard development
  • Insight generation
  • Documentation
  • Presentation
  • Portfolio preparation
APPLY WHAT YOU LEARN

Real-Time Data Analytics Projects

The focus of project work is to help students apply multiple tools to business-style datasets and demonstrate their analytical thinking.

PROJECT 1

Sales Performance Analysis

Analyze sales data containing 10,000+ transactional records to map seasonal trends and regional KPI variance across products, regions, categories, and time periods.

Tools: Excel, SQL, Power BI

Key Activities:

  • Clean sales records
  • Analyze monthly and regional performance
  • Identify top-performing products
  • Calculate important KPIs
  • Create interactive dashboards
  • Present business recommendations
Skills Developed: Data cleaning, SQL analysis, KPI development, dashboard creation, business reporting.
PROJECT 2

Customer & Marketing Analytics

Explore customer and campaign data to understand customer behavior and marketing performance.

Tools: Excel, Python, Power BI/Tableau

Key Activities:

  • Clean customer datasets
  • Explore customer segments
  • Analyze campaign performance
  • Identify patterns in customer behavior
  • Perform exploratory analysis
  • Build visual reports
  • Present actionable insights
Skills Developed: Python analytics, segmentation, EDA, visualization, business interpretation.
PROJECT 3

Business Operations Dashboard

Build an analytics solution for monitoring operational performance.

Tools: SQL, Python, Power BI/Tableau

Key Activities:

  • Extract relevant data using SQL
  • Clean and transform datasets
  • Analyze operational KPIs
  • Identify performance trends
  • Create interactive dashboards
  • Communicate findings to business stakeholders
Skills Developed: SQL, Python, data transformation, visualization, KPI reporting, data storytelling.

Capstone Project

End-to-End Business Analytics Project

The capstone brings together the major skills covered during the training.

You will start with a business problem and work through the complete analytics process:

Business problem Data collection Data cleaning SQL analysis Python / EDA Visualization Dashboard Insights Recommendations

The final project can become an important part of your portfolio and can also give you practical examples to discuss during interviews.

Build a portfolio you can talk about in interviews

4 real-time projects + a capstone, reviewed by mentors along the way.

Book a free demo
HOW YOU LEARN

Training Modes

CLASSROOM

Classroom Data Analytics Training in Madhapur (Near Gachibowli & Kondapur)

Attend instructor-led sessions at the Elearn Infotech training centre in Madhapur, Hyderabad.

Classroom training includes practical exercises, project work, mentor guidance, assignments, and doubt-clearing support.

ONLINE

Online Data Analytics Course

Prefer learning from home?

Join live online sessions with interactive training, project guidance, doubt-clearing support, and access to class recordings through the LMS.

Both learning modes are designed to provide the same practical focus.

COURSE DURATION

3 Months of training

The Data Analytics program is structured around 3 Months of training.

The overall schedule may vary depending on the batch format and learning pace.

For the latest batch timings, contact Elearn Infotech or register for a demo class.

COURSE FEES

Depends on format & batch

The Data Analytics course fees in Hyderabad can vary depending on the training format and batch type.

Elearn Infotech offers both classroom and online training options.

For the current fee structure, available offers, installment options, and upcoming batches, contact the Elearn Infotech team directly.

Thanks! We'll call you with the current fee details.
ELIGIBILITY

Who Can Join Our Data Analytics Course in Hyderabad?

The course is designed for a wide range of learners, including:

B.Tech graduatesB.Sc graduates B.Com graduatesBBA graduates BA graduatesFresh graduates Students looking for practical analytics skillsIT professionals Non-IT professionalsWorking professionals Finance professionalsMarketing professionals HR professionalsOperations professionals Sales professionalsProfessionals planning a career switch Perfect for freshers and professionals commuting from KPHB, Kukatpally, Ameerpet, and nearby localities looking for premium classroom labs.

You don't need to come from a computer science background to begin learning Data Analytics.

A COMMON WORRY

Do I Need Coding Experience?

No. Prior programming experience is not required.

The course is beginner-friendly and introduces Python from the fundamentals. You will gradually learn how Python can be used for data cleaning, analysis, and visualization.

The focus is not on becoming a software developer. Instead, you learn the programming concepts needed to work effectively with data.

GETTING HIRED

Data Analytics Training in Hyderabad with 100% Placement Assistance

Completing a course is only one part of becoming job-ready. Interview preparation, resume presentation, practical projects, and awareness of relevant job opportunities are equally important. Elearn Infotech provides Data Analytics Course in Hyderabad with placement assistance and career support to help students prepare for the hiring process.

Resume Preparation

Build a professional resume that highlights your analytics skills, tools, projects, and practical experience.

Mock Interviews

Practice answering technical and role-based questions in a simulated interview environment.

Job Alerts

Get updates about relevant job opportunities and openings shared through the placement team.

Interview Preparation

Prepare for interviews covering Excel, SQL, Python, statistics, Power BI, Tableau, projects, and business scenarios.

Career Guidance

Get guidance on building your portfolio, presenting projects, improving your interview skills, and approaching analytics opportunities.

WHERE IT LEADS

Career Opportunities After Data Analytics Training in Hyderabad

After developing practical skills in analytics, you can explore roles such as:

The exact role you qualify for will depend on your skills, educational background, project experience, and interview performance.

ON COMPLETION

Data Analytics Certification

After successfully completing the training and required projects, students receive a Data Analytics Course Completion Certificate from Elearn Infotech.

The certificate can be included on your resume and LinkedIn profile along with your project portfolio and technical skills.

The most important part of your profile, however, should be the practical work you can demonstrate during an interview.
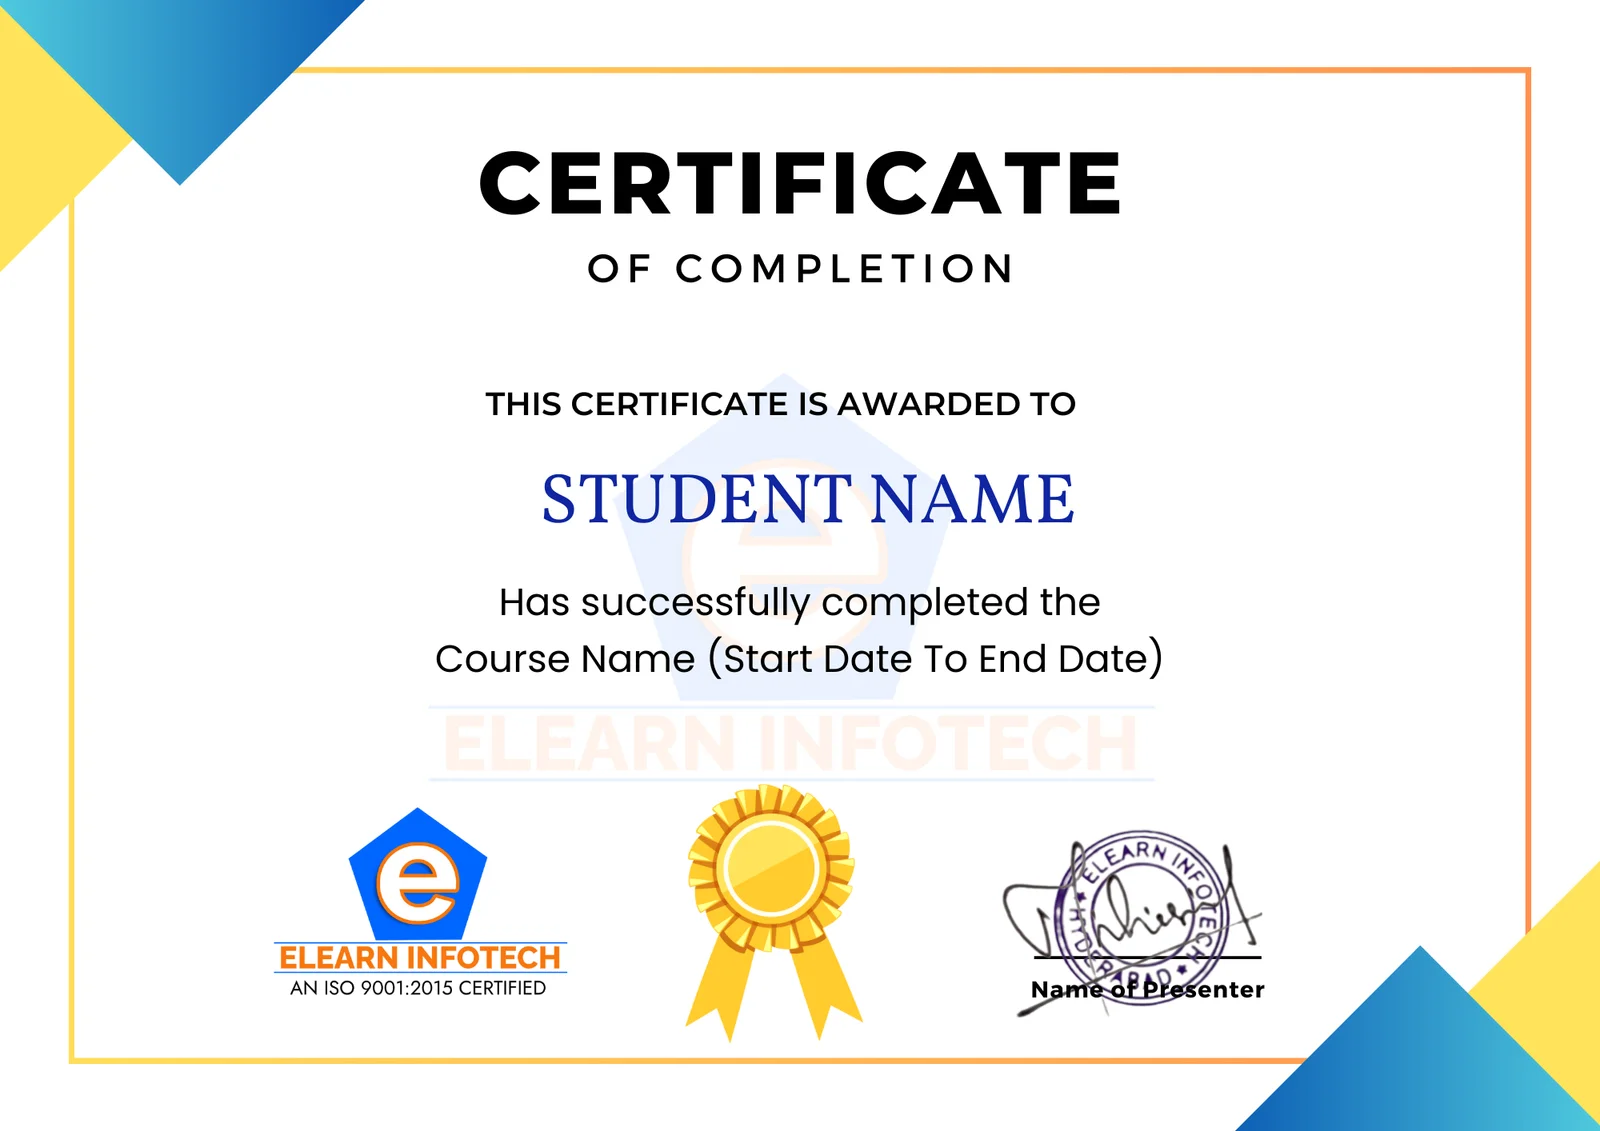
Elearn Infotech Data Analytics Course Completion Certificate sample
WHAT STUDENTS SAY

Reviews

“

The faculty explained Excel, SQL, Python, and Power BI with real-time examples. The placement team also helped me prepare for interviews.

“

The Power BI training was completely hands-on. We worked on real datasets, dashboards, and case studies.

“

I had no technical background, but the trainers explained every concept from basics to advanced in a simple way.

“

The mock interviews and resume guidance made a big difference.

QUESTIONS

Frequently Asked Questions

Data Analytics is the process of examining data to identify patterns, trends, relationships, and insights that can support better business decisions.

Yes. Freshers can begin with foundational skills such as Excel, SQL, Python, statistics, and data visualization and gradually build practical experience through projects.

The program covers Excel, SQL, Python, Power BI, and Tableau, along with statistics, data cleaning, exploratory analysis, visualization, reporting, and business analytics.

Yes. The program is designed for both IT and non-IT learners, including graduates from B.Tech, B.Sc, B.Com, BBA, BA and other backgrounds.

No. Python is taught from the basics with a focus on its application in Data Analytics.

Yes. Classroom Data Analytics training is available at Elearn Infotech in Madhapur, Hyderabad. Online training is also available.

The current training program is structured for 3 Months. The website also describes the broader program as approximately 2 months, with the exact schedule depending on the batch.

Yes. Elearn Infotech provides placement assistance that includes resume preparation, mock interviews, job alerts, interview preparation, and career support.

Yes. Students who successfully complete the Data Analytics training receive a course completion certificate from Elearn Infotech.

Yes. Elearn Infotech provides online Data Analytics training with live classes, doubt-clearing support, LMS access, recordings, and project guidance.

Data Analytics is the process of examining raw data to identify patterns, trends, and business insights. Yes, there is a strong demand for fresher data analyst jobs Hyderabad companies are hiring for. Our program explicitly targets entry-level skills to help you qualify for these open roles.

This is a comprehensive Excel SQL Power BI Python course Hyderabad program. It fully covers spreadsheet formulas, database querying via SQL, programming basics for Python for data analytics Hyderabad hubs require, interactive reporting in Power BI, and visual storytelling using Tableau.

The data analyst course fees in Hyderabad vary depending on whether you choose classroom center-based training or live online modules. Elearn Infotech offers budget-friendly pricing, flexible installment options, and seasonal promotional offers. Get in touch with our career advisor to receive the exact current fee structure.

Yes! We offer a dedicated data analytics course in Hyderabad with placement support. Our technical career readiness team guides you through resume presentation, portfolio construction around 3+1 live projects, mock interviews, and direct placement alerts to top hiring companies.

Our program is perfectly optimized as a data analytics course for freshers in Hyderabad looking to kickstart their career, as well as a flexible data analytics course for working professionals in Hyderabad seeking to switch roles. We offer customized learning tracks for both IT and non-IT backgrounds.

We provide flexible learning tracks to match your schedule. You can enroll in our offline data analytics course Hyderabad classroom program at our Madhapur center, or join the live interactive online data analytics course Hyderabad option featuring access to full class recordings.
VISIT US

Our Data Analytics Training Institute in Madhapur, Hyderabad

Elearn Infotech

Elearn Infotech
Plot Number 40, Second Floor,
Vittal Rao Nagar,
Madhapur, Hyderabad,
Telangana – 500081

Phone: +91 9502991480

The institute is located in Madhapur and provides classroom as well as online training options.

STILL HAVE QUESTIONS?

Send us a message

Ask about batch timings, fees, or which mode fits your schedule — our team replies within a day.

Visit the centre

Plot 40, 2nd Floor, Vittal Rao Nagar, Madhapur, Hyderabad

Response time

Within 24 hours, on working days

Thanks for reaching out! We'll get back to you within 24 hours.

Start Your Data Analytics Career with Elearn Infotech

Whether you're a fresher looking for your first analytics role, a working professional planning to upskill, or someone considering a career change, the right combination of skills + practical projects + portfolio + interview preparation can make a significant difference.

Learn Excel, SQL, Python, Statistics, Power BI, and Tableau through a practical, project-focused training approach.

Join the Data Analyst Course in Hyderabad at Elearn Infotech and start building skills that you can demonstrate—not just list on your resume.

Book Your Free Demo Class Today

Learn. Practice. Build Projects. Prepare for Interviews.

Call WhatsApp Free Demo